Start with the work you need, then put numbers beside it. RoomRenovation's published 2026 model compares broad room scopes so you can prepare a first brief. It is an educational estimate with disclosed assumptions, not a survey of homeowner invoices.
Read the model before using a range
The calculation is a room baseline in US dollars multiplied by a broad city factor. For selected Canadian, Australian and UK pages, a rounded planning currency factor is also applied. The result is rounded to the nearest 100. The city factor spans 0.90–1.40; the currency assumptions are 1.35 CAD, 1.55 AUD and 0.80 GBP per baseline USD. These are planning inputs, not live exchange rates or hourly trade prices. See the cost methodology for the formula and its limits.
The sources cited in that methodology help check construction-price direction. They do not publish the installed cost of every room. Exact area, condition, selected finishes, hidden damage and access still need a measured local quote. Design fees, permits, taxes and temporary accommodation should be separate lines in your own budget.
Different evidence answers different budget questions
Sources checked 3 October 2026: the Census/HUD 2023 American Housing Survey home-improvement release, published 30 October 2024, describes past household improvement activity. Its survey period and project categories are different from a current contractor quote or our room-and-city planning model.
The NAR/NARI 2025 Remodeling Impact Report compares project-cost estimates from NARI members with real-estate professionals’ estimated resale value. Those cost-recovery estimates do not measure the money your project will return. Neither source supplies the installed 2026 price of every room in every city. This guide does not copy a survey median or resale percentage into the model; obtain dated, itemized local quotes for your scope.
Find the right starting page
Choose the room and city in the renovation cost index. Read its low, middle and high points alongside the included scope. A range for a bedroom refresh should not be used to price a new bathroom or a loft conversion.
Compare one room at a time, then add shared project costs. Keeping a service location or a sound existing floor may save work, but inspect what is being retained before relying on that saving.
| Scope | Include in the brief | Ask the bidder |
|---|---|---|
| Cosmetic | Paint, hardware, lighting and retained furniture | Which preparation, disposal and repairs are included? |
| Replacement | Flooring, cabinetry and fixtures in existing positions | Are supply, installation and delivery separate allowances? |
| Layout or structural | Wall changes, new services, engineering and approvals | Who confirms feasibility and handles permits and inspection? |
| Custom | Measured joinery, special finishes and specialist trades | What drawings, deposits and lead times must be agreed? |
Turn the range into a budget you can use
Write one scope with measurements, photos, the things you want to keep and the finishes you are considering. Give the same document to every bidder. A cheaper total can simply mean that demolition, wiring, delivery or disposal was left out.
Keep allowances visible until you choose the actual product. Record its quantity, unit price, delivery and installation separately. Ask who pays if the old surface needs repair, and who carries the risk for owner-supplied products. A shelf price is only one part of the installed cost.
Set aside money for the uncertainties found during inspection. The right contingency depends on what is known about the property and the planned work. An older roof, concealed pipes or a wall whose structure is unclear deserves investigation before a fixed budget is signed.
Compare quotes without losing the details
- Measure the room and record access, parking, stairs and working-hour restrictions.
- Separate materials, labour, professional fees, approvals, taxes and waste removal.
- Request itemized quotes against the same written scope and finish schedule.
- Ask about exclusions, provisional sums, payment stages and who coordinates the trades.
- Confirm delivery dates and dependencies before committing to a start date.
A useful project schedule follows the work: survey and design, approvals where needed, ordering, removal, first-fix services, surfaces, installation, finishing and inspection. A quick cosmetic refresh and a habitable conversion have very different dependencies. Ask your contractor for a sequence based on the property rather than treating a generic week count as a promise.
Use a visual concept to make choices clearer
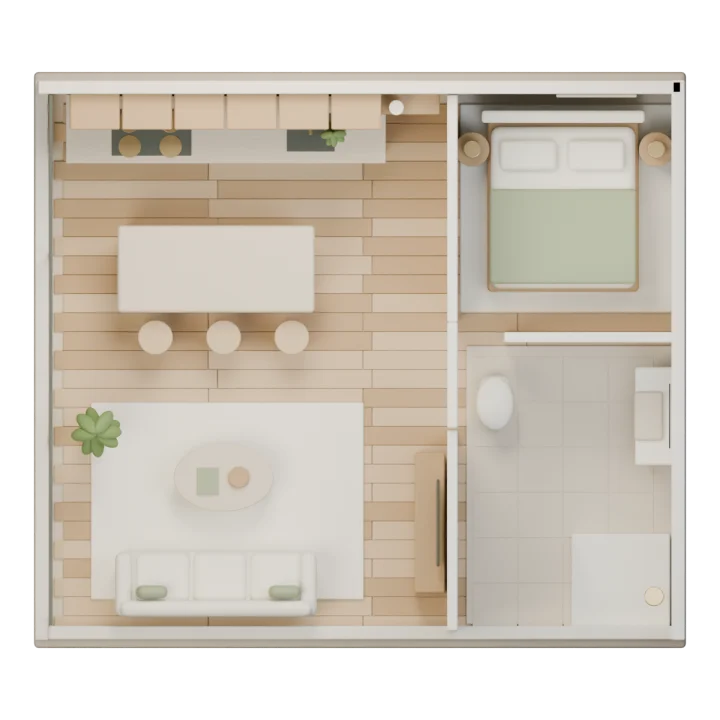
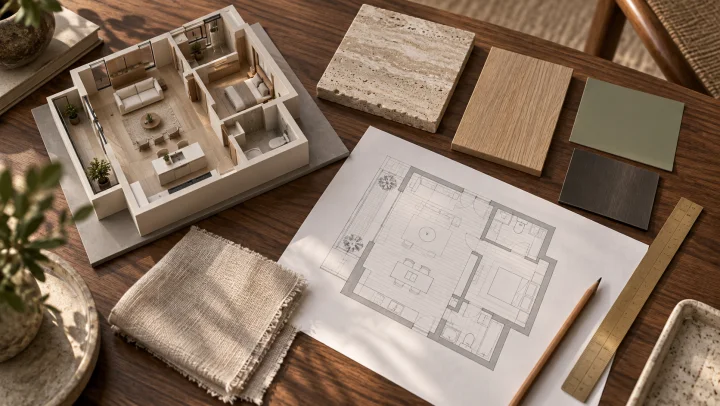
Upload an evenly lit photo and tell the studio which walls, openings and services must stay. Compare two directions using the same view. Note the finishes you like and the parts that the image changed incorrectly. Bring that shortlist to the people pricing your work.
Check samples in the real room before ordering. Light, wear, cleaning and installation details can change the decision. A convincing render helps communicate a direction; measured drawings and local professional checks determine what can be built.
Questions to answer before you buy
Does a planning range include my permits and tax?
Price these explicitly with your local contractor and authority. The model cannot calculate your property's permit, tax or inspection requirements.
Can I use the image as a construction drawing?
Use it as a reference for the brief. Your project team must verify dimensions, structure, services and approvals.
Will this renovation pay for itself when I sell?
There is no guaranteed return. Condition, buyer preferences and the local market affect value. Ask a local property professional before making a resale assumption.
What should I do next?
Start with the nearest room guide, prepare a measured scope, then replace the estimate with itemized local quotes.